School Banner

School Banner
School Logo

Monday, July 26, 2010

FACTORS AFFECTING THE RATE OF CHEMICAL REACTION

From previous classes we know that: Reactants------------------> Products, or a number of reactants combine to form a product / products. We can also say that the particles in the products collide in order for a reactant to be formed.

Depending on the types of reactant the time taken for a reaction to occur can vary considerably.

For example, the chemical reactions that occur in the formation of crude oil occur over huge periods of time whereas the chemical reactions betwen Sodium and Acid occur very quickly. So how do we determine / measure the rate of a reaction? We can say:

Rate of Reaction = amount of reactant(s) used or product(s) formed / Time Taken

We can look at either how much reactant is used up in the chemical reaction or the amount of product formed. Below is a simplified graph to show this relationship:

It can be seen that with higher temperatures and higher concentration and smaller pieces the line of the graph showing the relationship between the total amount of products used and the time taken is steeper, thus indicating the reaction is happening more quickly.

Equally if this graph was showing the total amount of reactants being used against time then the steeper line would, again, indicate, a faster rate of reaction.


What this graph tells us then is that there are a number of factors that determine the rate of the reaction. These are listed below:
  • The temperature at which the reaction takes place
  • The concentration of reactants being used
  • The pressure at which the reaction is occuring
  • The size of the pieces of reactants being used in the reaction
  • The addition of a catalyst
In simple terms:
  •  the higher the temperature the faster the rate of reaction
  • the greater the concentration of dissolved reactants the faster the rate of reaction
  • The higher the pressure of a reactsnt gas the faster the rate of reaction
  • the smaller the pieces of a solid reactant the faster the rate of reaction
  • if a catalyst is added the faster the rate of reaction
Again, keeping it simple:
  • with higher temperatures the greater the energy of the particles in the products and the more likely they are to react when they collide with other particles
  • with greater concentrations of particles or pressure in gases the greater number of particles there are thereby increasing the chances of collisions at high enough energy levels to create a reaction
  • with smaller pieces of solids both the surface area and the number of pieces are increased, thereby increasing the number of collisions which will speed up the chemical reaction
  • if a catalyst is added the activation energy needed to result in a reaction when particles collide is lowered, thereby increasing the rate of the reaction. Catalysts are added to a reaction but are not used up
The slide show below gives a greater depth of detail if you are interested:


an excellent site with more on this as well as lots of other science topics

Thursday, July 8, 2010

GRAPHING TUTORIAL

When having to draw graphs and interpret data the starting point is making sure the correct axes are used. The independent variable goes on the X axis (horizontal axis) and the dependent variable goes on the y axis (vertical axis).

From designing our Fair Tests we know that the Independent Variable is the variable that we, as Scientists, change, making sure that we only use the 1 independent variable. As we change the value of the independent variable we observe what happens to the Dependent Variable. If we have designed a good Fair Test then there should be a relationship between the two; this is what we are testing. Time is often an Independent variable that is used with observations being observed for any changes in the chosen dependent variable over time.

For example we could look at changes in rate of growth of microorganisms on an agar plate over time. With all other variables being controlled, such as temperature, nutrient source, sterilisation etc then time which is obviously measurable is the independent variable and changes in growth is the dependent variable. If we changed the fair test to study the effects of different concentrations of disinfectant  on microorganism growth then the concentrations of disinfectant we have chosen, and measured, would be the independent variable.

Returning to graphs there are a number of types of graphs we can draw depending upon the type of data being analysed. Some of the most common include:
  • Line Graphs
  • Bar Charts
  • Pie Charts
Generally the most common type of graph we will be concerned with plotting is a line graph which are particularly good for plotting data that changes over time, with time often being the independent variable, plotted on the x axis.For further information on different types of graphs press here.

The science buddies website has more useful information:
this page gives a good overview and lists key points when drawing up graphs!


Monday, June 28, 2010

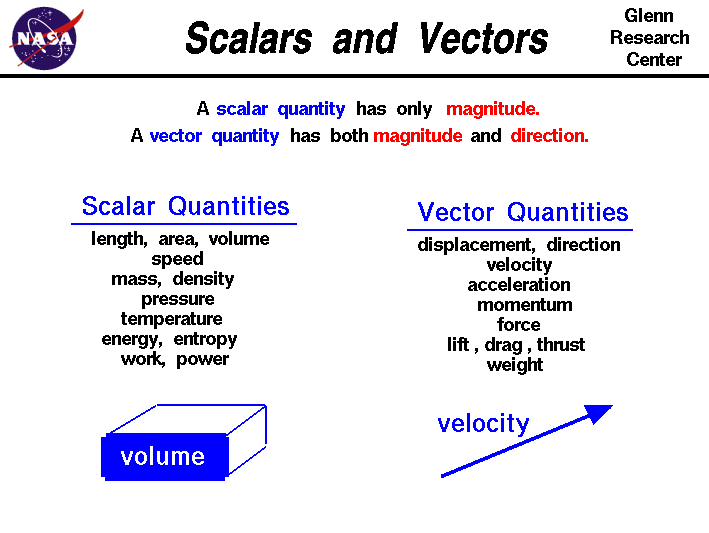
SCALAR AND VECTOR QUANTITIES

  As can be seen from the diagram Scalar quantities only have a magnitude whereas Vector quantities have a direction and a magnitude. Therefore speed for example is a scalar magnitude whereas velocity is a vector quantity because it has both a magnitude and a direction; velocity is speed in a given direction

CLICK HERE FOR MORE INFO ON VECTORS

Tuesday, June 22, 2010

METAL REACTIVITY SERIES AND DISPLACEMENT REACTIONS 2

As a follow on form the previous post here is a bit more info...

DISPLACEMENT REACTION IN SOLUTION
A more reactive metal will displace a metal from it's compound in solution.
Observations could include:
  • the more reactive metal gradually dissolves
  • the less reactive metal coats the more reactive metal
  • the solution may change colour
  • theat is given out because these reactions are exothermic
  • fizzing may occur
Here are two examples of these reactions:
  1. Magnesium and Copper Sulphate solution
Magnesium is more reactive than Copper so it displaces Copper from the Copper Sulphate Solution.

The Word equation is:

Magnesium + Copper Sulphate
---------> Magnesium Sulphate + Copper

The Magnesium has been coated with Copper in this displacement reaction


2. Iron and Copper Sulphate Solution

Iron is more reactive than Copper so it displaces the Copper from the Copper Sulphate Solution.

The word equation for this reaction is:

Iron + Copper Sulphate
------------> Iron Sulphate + Copper

The Iron becomes coated with Copper in this displacement reaction

However the rate of this reaction is much slower (it takes much longer) as Iron and Copper are much closer together in the Reactivity Series


Metal                           Compound in Solution
                                     MgSo4            CuSo4            FeSo4
Mg                               No                    Yes                 Yes                             
Cu                                No                     No                 No
Fe                                No                      Yes                No

  • A metal will not react with it's compound

  • Magnesium is the most reactive of the three because it reacted with the other two metals

  • Copper is the least reactive because it didn't react with compounds of  the other two metals

  • Note that the compound itself is not important, only the metal it contains, so Copper Nitrate, for example, would give the same answer as Copper Sulphate
Displacement reactions also occur with solid metal oxides, but that is for another post.


.           

Monday, June 21, 2010

METAL REACTIVITY AND DISPLACEMENT REACTIONS

 This post should help with Year 11PY internal assessment 1.1

The reactivity series to the side shows a list of metals, with the addition of two non metals: carbon and hydrogen, arranged in order of their reactivity from most reactive to least reactive.By using the reactivity series we can predict what will happen in displacement reactions. The reason carbon and hydrogen are included in this list is because carbon is used in the extraction of iron ore and any metals below hydrogen in the list will not react with dilute HCl.


Metals react by losing electrons which is oxidation; metals are the reductant, ie they donate electrons.

When metals react with other other metals in a metal salt solution a displacement reaction takes place; a more reactive metal will take the place of a less reactive metal. In other words the more reactive metal donates electrons to the less reactive metal (existing in ion form).


The key point is that if a less reactive metal is added to a metal salt solution which contains metal ions from a more reactive metal then there will be no displacement and no reaction will take place. Therefore if we put Copper, Lead, Zinc, Aluminium into a solution of Magnesium Sulphate as Magnesium is more reactive there will be no reaction and nothing to observe as the Magnesium 'wins the competition' for the Sulphate ions.


Other Metal Salts that can be used are Nitrates and Chlorides for example.


In the practical carried out another example may help in consolidating knowledge. If we take Zinc and a solution containing Copper ions, in this case Copper Sulphate what is going to happen?
  • Looking at the reactivity series above it can be seen that Zinc is more reactive than Copper
  • Zinc being more reactive forces the Copper ions to accept electrons, ie Zinc acts as a reductant by donating electrons to the Copper ions in solution, which become Copper metal atoms
  • Zinc then accepts the Sulphate ions and becomes oxidised and becomes Zinc Sulphate
  • The Zinc metal will discolour and the blue Copper Sulphate solution fades in colour
  • We can say that Zinc has displaced the Copper ions from the Copper Sulphate solution
 If we discount the spectator ions (Sulphate ions) the ionic equations are:
  • Zn -----------------> Zn2+ + 2e
  • C2+ + 2e ----------------> Cu

Using this information and the reactivity series you should be able to work out what metals will displace other metal ions from a metal salt solution

Sunday, June 20, 2010

DEVISING A FAIR TEST WHEN DOING A PRACTICAL

This revision post should interest both Year 10 SiA1 and 11 PY as both classes are involved in doing practical investigations with direction; ie designing and implementing and writing up an experiment. Before carrying out the actual practical assessment the opportunity is being given for a practice run.

  • in the case of year 10 the practice is to do with designing a Fair Test to investigate something to do with the swing of a pendulum. This will be followed up by another practice, this time called Hot Wheels


  • in the case of year 11 the practice will be with a Metal Activity Series


This link gives a simplified step by step guide to designing a fair test

The main points are:
  • Come up with an Hypothesis / Statement against which you are going to implement your Fair Test. If it is a statement this should be a statement of what you think is going to happen
  • Identify the following variables: independent, dependent and control variables and make sure to list them all stating which type of variable they are
  • The independent variable, which is plotted on the x axis, is the variable you have identified in your hypothesis as affecting the dependent variable, and is the ONE variable that you are going to change
  • The dependent variable is the variable that is going to change as a result of you changing the independent variable, and is plotted on the y axis
  • The control variables are all the other variables that could affect the fair test if you do not 'control' them, ensuring they are always the same
  • Make sure that a full step step methodology is written down in your Fair Test stating how you are going to ensure that the test is fair, ie how you are going to measure the independent variable making sure that all the other control variables are taken into account and kept the same throughout the test. This methodology should be easy and simple enough for another group of students to pick up and carry out the same experiment you have just written and carried out!
  • Make a table of observed results and a graph if appropriate
  • Draw up your conclusions and evaluate whether the Fair Test you carried out was fair and either proved or disproved your original statement/hypothesis. Bear in mind that depending on your original statement you may or may not agree with the hypothesis; this is alright as long as you have carried out a fair test. If things did not work out as expected then your evaluation should include what you would change, or do differently, next time
Here is a link to a cool little simulation about the pendulum (particularly relevant to the10SiA1 class)